W.W. GRAINGER (GWW)·Q4 2025 Earnings Summary
Grainger Q4 2025: EPS Beats, FY26 Guidance Surges Above Consensus
February 3, 2026 · by Fintool AI Agent
W.W. Grainger reported Q4 2025 results that beat on the bottom line while issuing FY2026 guidance materially above consensus estimates. Despite operating margin compression and challenging macro conditions, the MRO distributor delivered 4.5% revenue growth and returned $1.5 billion to shareholders during the year.
Did Grainger Beat Earnings?
Yes — Grainger beat on EPS but results were mixed overall.
Key Q4 2025 highlights:
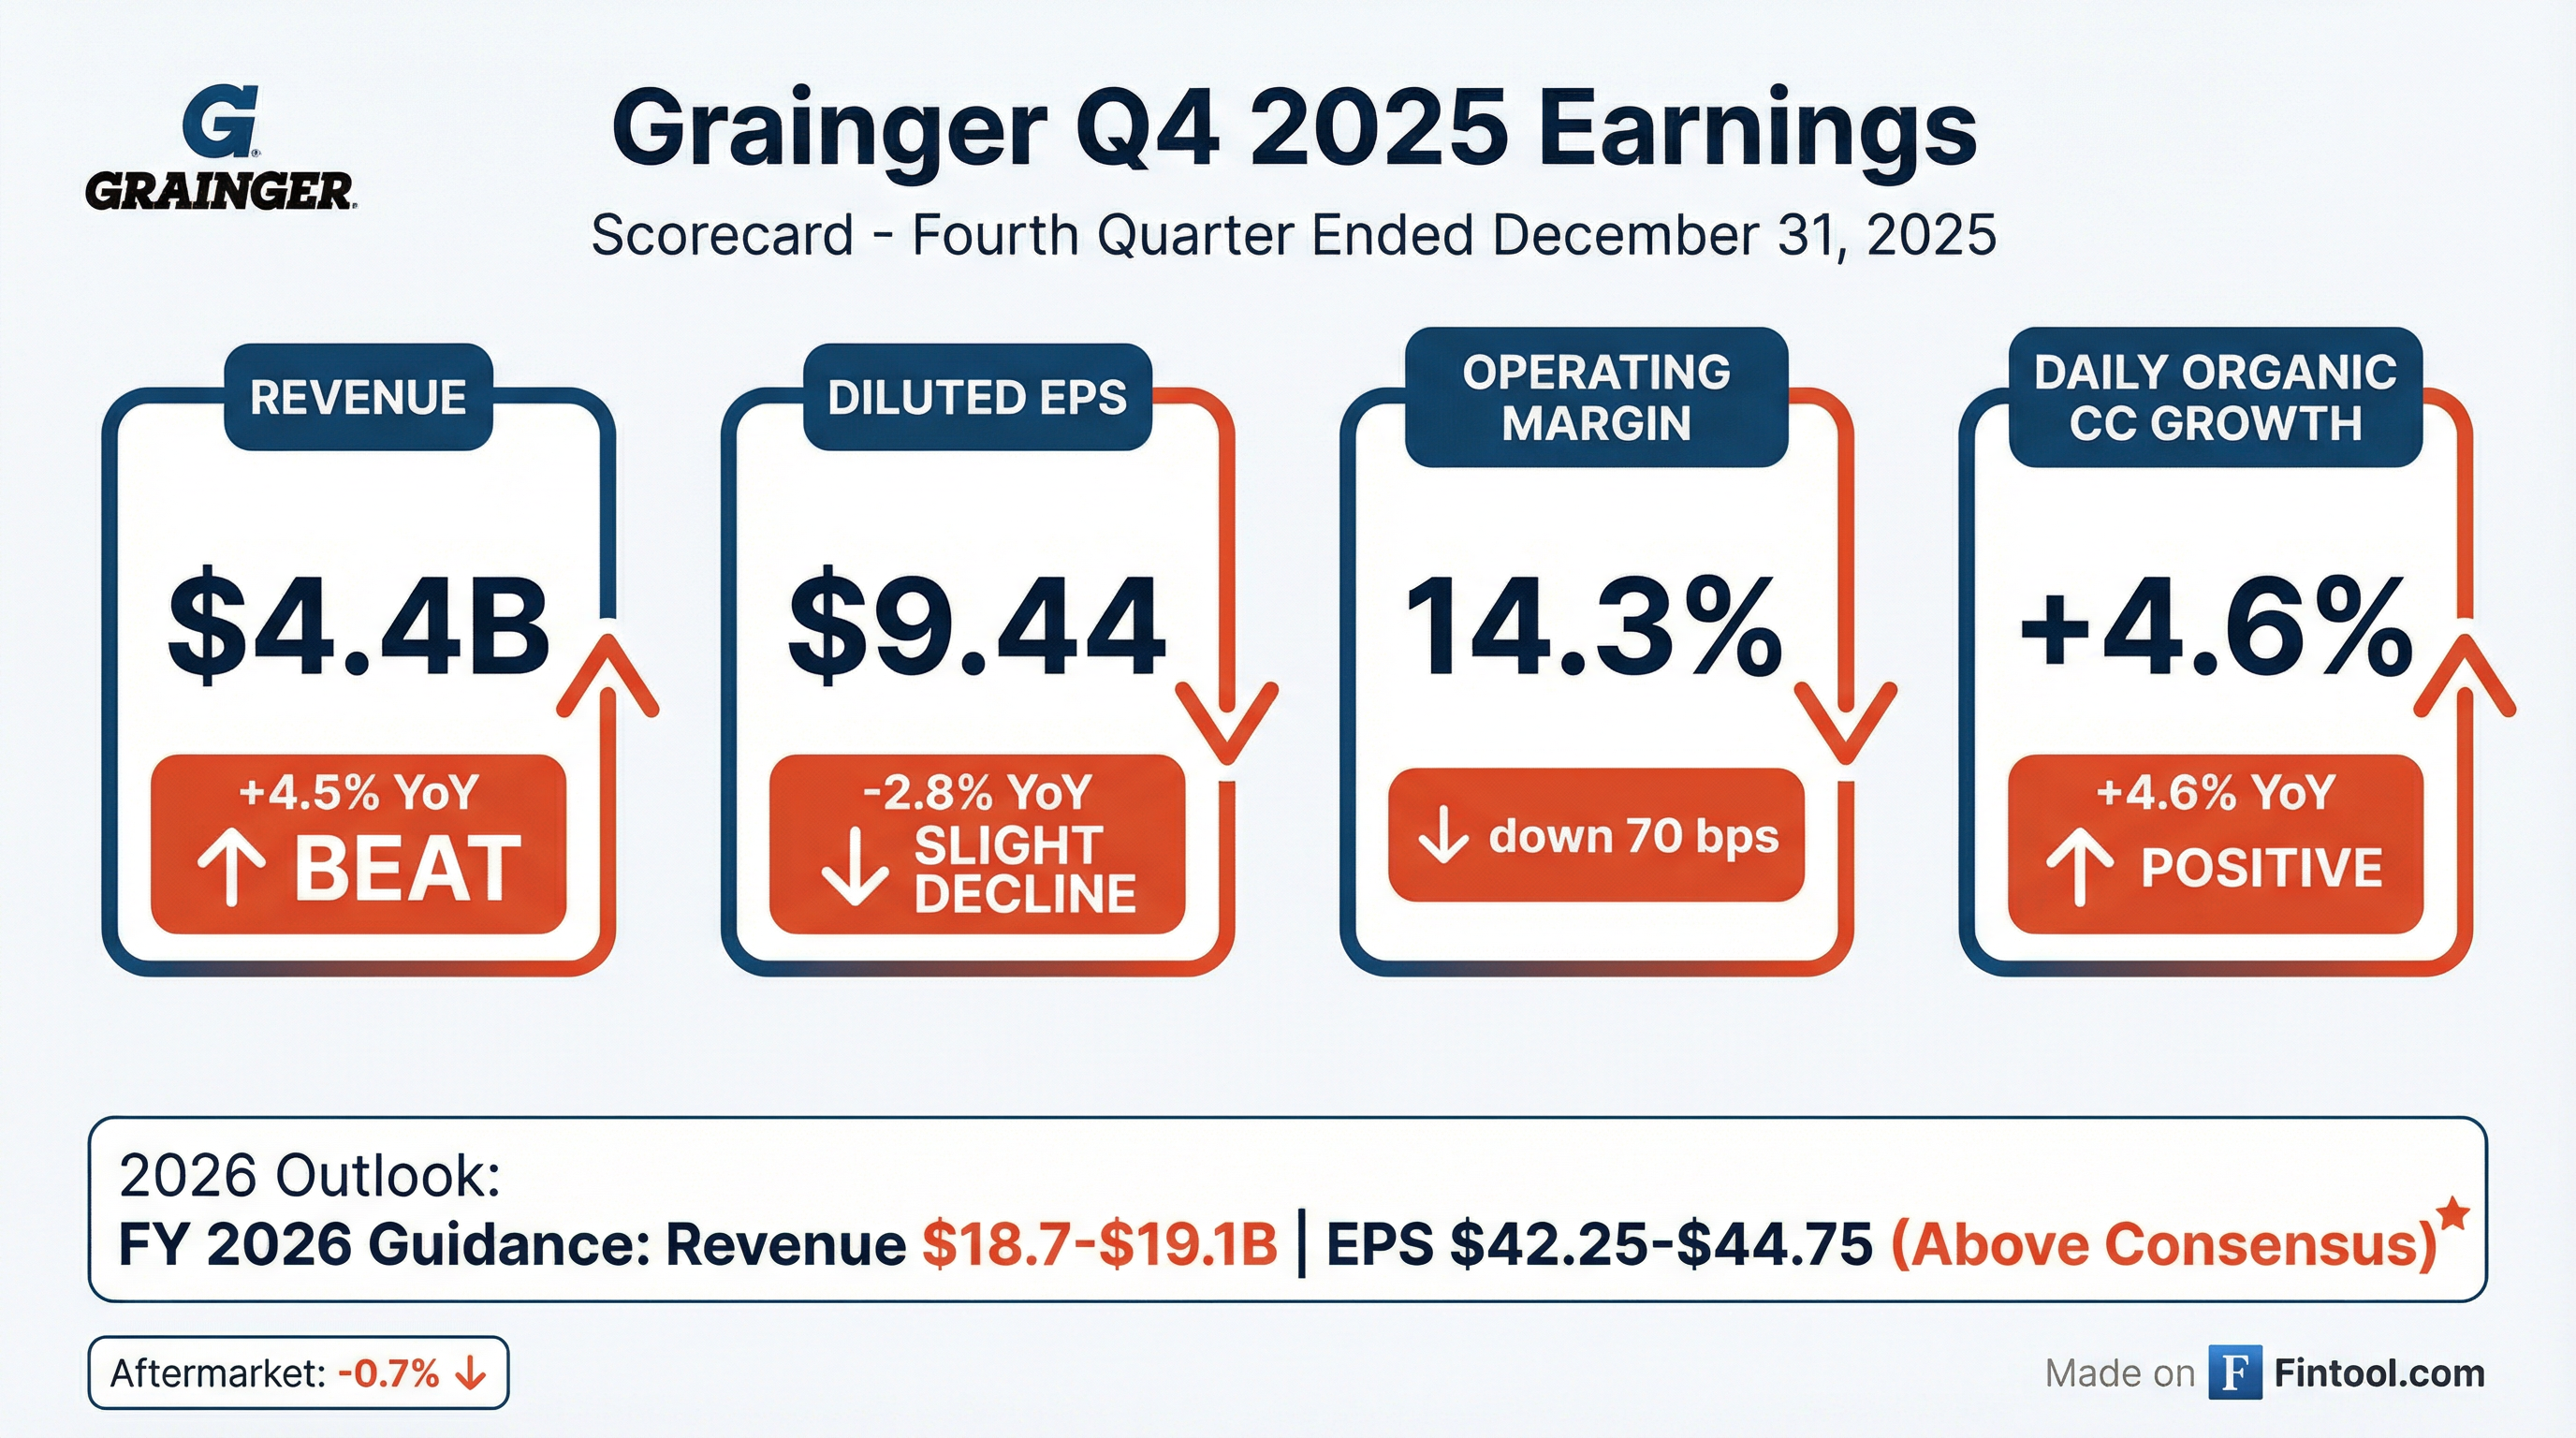
- Revenue of $4.4 billion increased 4.5% YoY, or 4.6% on a daily, organic constant currency basis
- If normalized for government shutdown and prior year hurricane benefit, total company would have been up ~6.5% daily organic CC
- Diluted EPS of $9.44 declined 2.8% YoY, above the midpoint of implied Q4 guidance
- Gross margin of 39.5% decreased ~10 bps driven by segment mix headwinds from faster-growing Endless Assortment
- High-Touch Solutions U.S. achieved ~250 bps volume outgrowth for FY25 using the multifactor MRO market model
What Did Management Guide?
FY2026 guidance came in significantly above consensus — the headline positive from this report.
Segment margin targets for 2026:
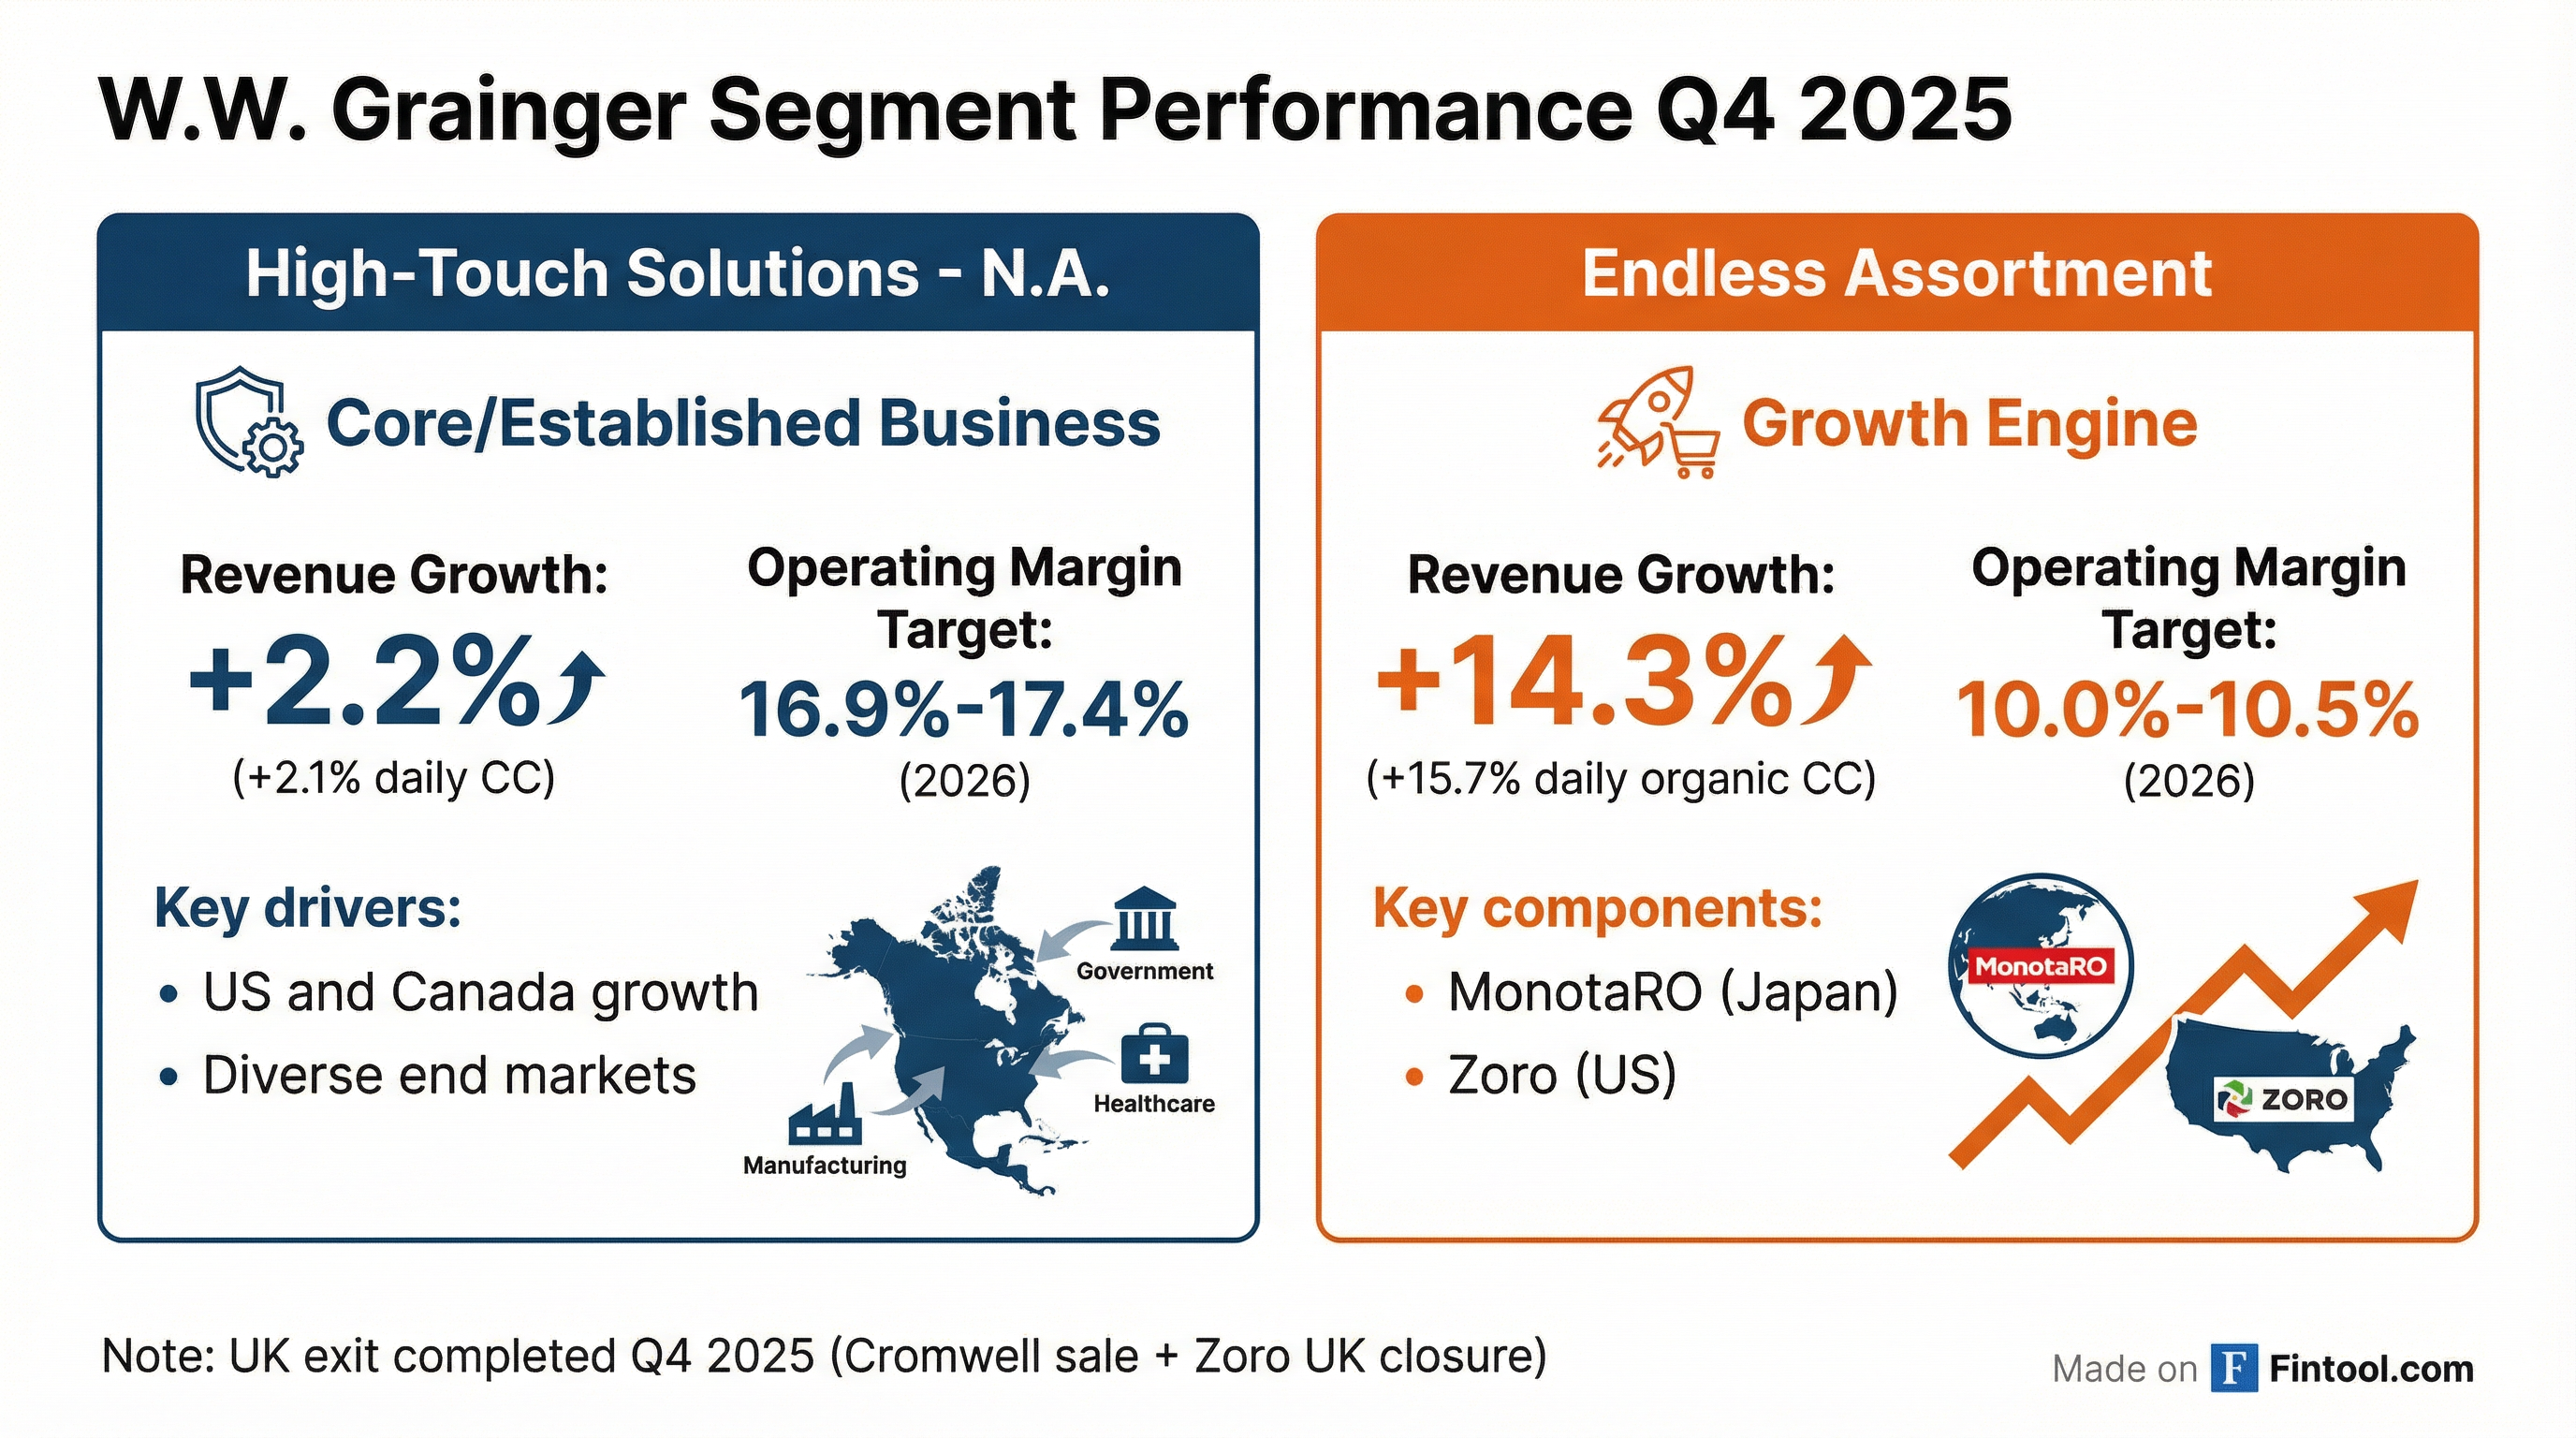
- High-Touch Solutions N.A.: 16.9% - 17.4% (+35 bps at midpoint)
- Endless Assortment: 10.0% - 10.5% (+20-70 bps)
Key guidance assumptions:
- MRO market: -1.5% to flat volume (continued contraction)
- Price contribution: North of 3% (including ~2.5-3% from prior year wrap)
- Effective tax rate: ~25% (~130 bps unfavorable vs. FY25)
- Share repurchases: ~$1 billion
- CapEx: $550M - $650M
The guidance implies meaningful margin expansion from FY25's adjusted 15.0% operating margin, driven by normalization of tariff-related cost pressures (particularly LIFO headwinds subsiding in H2), continued operating leverage, and a 45 bps tailwind from the U.K. exit.
How Did the Stock React?
Muted initial reaction despite strong guidance.
The stock entered earnings near 52-week highs, suggesting strong guidance may have been partially priced in. Grainger shares have significantly outperformed over the past year, rallying from under $900 to over $1,100.
Historical earnings reactions (last 4 quarters):
What Changed From Last Quarter?
Several notable shifts from Q3 2025:
-
U.K. Exit Completed — The sale of Cromwell and closure of Zoro U.K. was announced in Q3 and completed in Q4 2025. This resulted in a $196 million loss impacting FY25 reported results.
-
Tax Rate Headwind — Q4 effective tax rate of 22.8% was unfavorable vs. 20.1% in Q4 2024, driven by the prior year benefiting from a tax reserve release.
-
Healthcare Cost Spike — Management cited "unforeseen healthcare costs" as a driver of SG&A pressure during the quarter.
-
Tariff Impact Normalization — FY25 gross margin of 39.1% was pressured by tariff-related inflation causing unfavorable price/cost timing and LIFO headwinds. FY26 guidance implies this normalizes.
How Did Each Segment Perform?
High-Touch Solutions N.A.
Growth driven by strong performance with contractor and manufacturing customers, which helped offset slower growth in other areas including government. Results included nearly 3 points of price inflation showing meaningful sequential improvement as tariff costs were passed. If normalized for government shutdown and prior year hurricane benefit, segment would have been up ~4.5% daily CC.
Endless Assortment (MonotaRO + Zoro)
MonotaRO margins at 13.6% (+100 bps), Zoro margins improved to 6.3% (+260 bps). MonotaRO experienced increased web traffic from a competitive cyber outage providing a tailwind. Both businesses driving improved repeat purchase rates with core B2B customers.
Full Year 2025 Summary
Adjusted figures exclude the $196M loss from the U.K. market exit (Cromwell sale + Zoro U.K. closure) and prior year restructuring costs.
Capital Allocation
Grainger continued its shareholder-friendly capital allocation strategy:
The company returned $1.5 billion to shareholders through dividends and repurchases during FY25, with buybacks expected to continue at a similar pace in FY26.
Management Commentary
CEO D.G. Macpherson on execution:
"Despite the macroeconomic uncertainty and challenging environment in 2025, the Grainger team continued to execute against our strategy, delivering exceptional service and a best-in-class experience for our customers."
On the 2026 outlook:
"Looking ahead, I'm excited about how 2026 is shaping up and confident in our ability to extend our advantage for the long term. Regardless of the environment, we will continue to provide a best-in-class MRO offer while investing in the core of our business."
On AI and technology:
"We have broad experience applying AI and machine learning, and when underpinned by our differentiated data assets, we can create tremendous value... We've learned a great deal in the past two years about AI and feel well positioned to accelerate these efforts moving forward."
Key Risks to Monitor
-
Macro Sensitivity — High-Touch Solutions N.A. growth decelerated to +2.1% daily CC, reflecting challenging industrial conditions
-
Tariff Uncertainty — Tariff-related inflation caused FY25 gross margin pressure; guidance assumes normalization but trade policy remains uncertain
-
Healthcare Costs — "Unforeseen healthcare costs" cited as Q4 SG&A headwind; could persist
-
Execution on Guidance — FY26 guidance significantly above consensus requires strong execution to achieve
Q&A Highlights
The earnings call Q&A featured questions from David Manthey (Baird), Jake Levinson (Melius Research), Ryan Merkel (William Blair), Tommy Moll, and others. Key themes:
On January's Strong 10%+ Start:
"As we plan, we always start planning relatively conservatively... What I would say about January, certainly it was strong across the board, but we did get a bit of a tailwind from the competitive outage in Japan." — CEO D.G. Macpherson
On Customer Sentiment:
"There's no panic, but there's not really enormous tailwinds that people are seeing from a volume perspective... Generally, the mood is okay, but not expecting huge market growth." — D.G. Macpherson on customer conversations
On Tariff Pricing:
"We have essentially passed through all known tariffs and working in this quarter to also correct for some of the Chinese tariffs that were rolled back in November... We haven't seen tremendous pushback from customers." — CFO Dee Merriwether and D.G. Macpherson
On Digital Channels:
"EDI/ePro is the biggest share we have at this point, closer to 40%... The vast majority of our contract customers now have a combination of ePro and KeepStock on site." — D.G. Macpherson on channel mix
On Q1 Gross Margin Decline: Q1 gross margin expected to decline sequentially due to: (1) continued LIFO headwinds from tariff costs, (2) Grainger sales meeting impact (~20 bps drag), and (3) private label competitiveness pressure from tariffs.
Strategic Growth Engines
Management highlighted progress across five strategic growth engines driving share gain:
1. Merchandising
- Net assortment growth of 85,000+ SKUs in 2025 — largest net SKU growth in nearly a decade
- Expanded into data center products and factory automation (sensors, machine controls, actuators)
2. Marketing
- Leveraging machine learning to optimize investment at SKU level based on relative pricing, product availability, and customer lifetime value
3. Seller Coverage
- Added ~110 new sellers across two geographies in 2025
- Total program expansion to 300+ sellers across six geographies since 2022 — 10%+ increase in U.S.-based sales team
- Planning to address two more regions in 2026
4. Seller Effectiveness
- Strong usage of new Seller Insights platform integrating customer data
- 2026 plans: leverage AI on platform to deliver actionable insights and identify new customer contacts
5. KeepStock (On-Site Services)
- Increased demand from labor scarcity and customer cost savings initiatives
- New customer-facing tools expected for broader rollout in 2026
MRO Market Model Update
Management provided a detailed explanation of their shift to a multifactor MRO market model vs. the traditional single-factor IP benchmark:
- Why the change: The single-factor IP benchmark became misaligned with actual customer demand, likely due to shifting macroeconomic dynamics and industry bifurcation from tariffs
- New model: Incorporates net core capital goods shipments, import-export dynamics, and end user activity across a broader base of end markets
- FY25 outgrowth: Using the multifactor model, Grainger achieved ~250 bps volume outgrowth (vs. 400-500 bps long-term target)
Management noted prolonged dislocation between models since the pandemic, with models moving in opposite directions after tariffs were enacted in early 2025.
Q1 2026 Preliminary Outlook
January got off to a strong start, supporting Q1 expectations:
Gross margins expected to decline sequentially vs. Q4 due to LIFO pressure and Grainger sales meeting impact, but offset by SG&A leverage improvement.
What to Watch Next Quarter
- Macro indicators — Industrial production trends and customer demand patterns
- Margin progression — Whether tariff headwinds actually normalize as expected
- Endless Assortment momentum — Can MonotaRO and Zoro sustain mid-teens growth?
- Capital deployment — Buyback cadence and any M&A activity
- Outgrowth reacceleration — Can seller coverage and seller effectiveness drive improvement toward 400-500 bps target?
- Q1 gross margin — Will LIFO and Grainger Show headwinds play out as expected?
Additional Resources
- GWW Company Profile
- Q4 2025 Earnings Call Transcript (when available)
- Q3 2025 Earnings Review
Data sourced from company filings and S&P Global. Stock prices as of market close February 2, 2026.